In the world of social media analytics, few metrics are as misunderstood yet as vital as “Back taps” or the “Back” action. While “Forward taps” often indicate a user’s desire to move through content quickly, a “Back” action signals something far more potent: Recapture of Attention. In 2026, where the average digital attention span is measured in milliseconds, having a user go backward to see your content again is the ultimate sign of high-value media.
This guide provides a professional forensic analysis of the “Back” metric. We will define the difference between the physical gesture and the analytical data, explore the psychology of why users backtrack, and teach you how to use this data to identify your most viral “Information Hubs.” Whether you are a brand auditor or a creative enthusiast, understanding the power of the “Back” action is key to mastering the Instagram algorithm.
Analytical Roadmap
1. Defining the “Back” Metric
In its simplest technical form, a “Back” tap is recorded whenever a viewer taps the left-hand side of their smartphone screen while viewing your Story. This action forces the app to jump one slide backward in your current Story sequence. From a data perspective, this is a Signal of Intentional Re-consumption. Unlike “Forward” taps, which occur when a user is bored or seeking the next beat, a “Back” tap confirms that the user saw something they found interesting, confusing, or visually stunning enough to warrant a second look.
In 2026, Instagram categorizes this as a “High-Weight Interaction.” In your professional dashboard, “Back” is grouped under “Navigation” metrics. It is a raw count of how many times the left-side gesture was used. It’s important to distinguish this from “Previous Story,” which is a swipe-right gesture to return to another user’s content. “Back” is internal to your narrative. It indicates that the sequence of your Story is keeping people in a loop of consumption, which is the most valuable state for high-engagement accounts.
2. Back vs. Forward Taps
The tension between “Back” and “Forward” taps is the core of Story storytelling. A “Forward” tap is often misinterpreted as a positive signal, but in high-depth marketing analytics, it often indicates **Content Attrition**. It means the user is ready for the next slide *before* your current one finished its 15-second lifecycle. In contrast, a “Back” tap is the inverse; it means your previous slide’s lifecycle was too short for the amount of value it provided, forcing the user to re-invest their time.
When auditing your account, you want a specific ratio. A high “Back” count combined with a low “Exit” count is the “Holy Grail” of Instagram Stories. This means users are not only finishing your Story but are actively re-watching parts of it. In 2026, the algorithm recognizes this “Re-watch Velocity” as a major quality score, often pushing your Story bubble to the very front of your followers’ tray. Understanding this balance allows you to stop worrying about raw views and start focusing on **View Depth**.
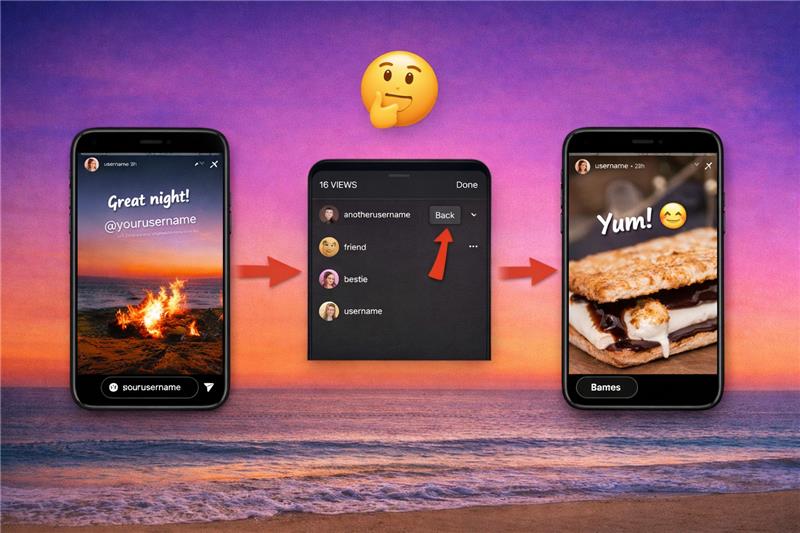
3. Navigating to the Analytics Dashboard
Finding the “Back” metric requires a Business or Creator account. If you are a standard Personal account, this data is hidden by Instagram’s API. To access the numbers, open your active Story and swipe up. Tap the “Graph” icon to enter the Insights tab. Scroll down to the “Navigation” section. Here, you will see four distinct pillars: Back, Forward, Next Story, and Exited. In 2026, this UI has been streamlined to show these as percentages of total reach, giving you an immediate sense of engagement efficiency.
If you are looking for historical data, navigate to your Profile > Professional Dashboard > Insights > Content You Shared > Stories. From here, you can filter for “Back” actions over the last 90 days. This historical view is essential for identifying “Pattern Trends.” If your “Back” taps spike every Tuesday when you post a specific tutorial, the data is telling you that Tuesday’s format is your “High-Stickiness” content. Ignoring this dashboard is like flying a plane without a radar; you might be moving, but you don’t know why or where you’re gaining lift.
4. Psychology: Why Users Go Back
The human brain is wired for Pattern Completion. When we see something that doesn’t immediately “compute”—like a dense block of text, a hidden detail in a photo, or a fast-paced recipe—we feel a psychological itch to go back and resolve the curiosity. This is the primary driver of the “Back” tap. It isn’t just about liking the content; it’s about the brain requiring more time to process the visual or linguistic data presented on the slide.
In a professional context, this is called **Cognitive Friction**. While too much friction causes users to exit (leave your story), the right amount of friction causes them to go back. For example, if you post a slide of your “10 Best Tips for SEO” but only leave it up for 5 seconds (if it’s a short video), the user must go back to read them all. This interaction increases the total “Time on Slide” metric, which is the most powerful signal you can send to the Instagram ranking engine. Understanding this allows you to intentionally engineer curiosity into your posts.
5. Identifying “Information Hubs”
In Story analytics, a slide with an unusually high number of “Back” taps is known as an Information Hub. This is content that is so dense or valuable that it requires multiple passes. For influencers, this is often a slide with “Affiliate Links” or a “Coupon Code.” For educators, it’s a “Diagram.” By identifying these hubs, you can reverse-engineer your success. If Slide 3 of your 10-slide Story has 500 “Back” taps, that specific slide is your most effective piece of intellectual property.
In 2026, pro marketers use these Hubs as “Anchors.” If you know a specific topic causes people to backtrack, you place that slide in the middle of your Story sequence. This acts as an “Attention Reset.” As users start to fade during a long Story sequence, the Information Hub forces them to stop, think, and interact, effectively “refreshing” their attention for the remaining slides in the deck. This is a master-level pacing technique used by top-tier creative agencies.
6. Back Action vs. Previous Story
It is vital to distinguish between a “Back” tap and a “Previous Story” swipe. While a “Back” tap is an internal vote of confidence for *your* content, a swipe-right (Previous Story) is an action that takes the user *away* from your content and back to the person they were watching *before* you. In your analytics, “Previous Story” is often a neutral or slightly negative signal—it means they were only viewing your Story by accident because they auto-played into it from someone else.
The “Back” action, however, occurs while the user is already “opted-in” to your narrative. In 2026, the distinction is clear: “Back” builds Internal Affinity, while “Previous” is simply Navigation Noise. If your “Previous Story” counts are high, it means your first slide isn’t doing enough to hook the audience, and they are quickly trying to return to the creator they were previously engaged with. Focus your energy on increasing internal “Back” taps while decreasing “Next Story” swipes to achieve total dominance in the story tray.
7. Negative Contexts: When “Back” is a Bad Sign
Not every “Back” tap is a compliment. Sometimes, a high “Back” count is a symptom of Poor Usability. If your text is too small to read, if the font color clashes with the background, or if you placed a clickable link too close to the left edge of the screen, users may be tapping “Back” out of frustration or by accident. This is known as “Accidental Navigation,” and it can skew your data into thinking your content is more engaging than it actually is.
To audit for this, check your **Exit Rate** on that specific slide. If you have high “Back” taps but also an extremely high “Exit” rate, users are likely frustrated. They tried to read something, couldn’t, tapped back to try again, gave up, and left. In 2026, professionals avoid this “Bait-and-Switch” by following high-contrast design principles. Your goal is to make the content “hard to finish” because it’s valuable, not because it’s illegible. Precision in design is the foundation of clean data.
8. Impact on Story Ranking & Algorithm
Instagram’s 2026 ranking algorithm is focused on Active Interaction Depth. Static views mean very little; the algorithm wants to see users *moving* the interface in response to your content. A “Back” tap is one of the strongest “Retention Signals” because it increases the total “Time Spent” on your account. The algorithm reasons: “If a user went back to watch this again, it must be higher quality than the 500 other stories currently in their feed.”
This results in a Positive Feedback Loop. As your “Back” taps increase, Instagram moves your Story bubble closer to the front of the line for your followers. This increased visibility leads to more views, which leads to more “Back” taps, and so on. For creators looking to break out of a reach plateau, engineering content that encourages a second look is the single most effective “organic hack” available. It isn’t about the number of followers you have; it’s about the intensity of the engagement from those you do have.
9. Using “Back” Data for Ad Optimization
If you are running “Instagram Story Ads,” the “Back” metric is your most cost-effective diagnostic tool. When a user taps back on an ad, it means your “Hook” worked, but your “Offer” was too fast to digest. In 2026, successful ad agencies use the “Back” count to determine the Information Velocity of their campaigns. If an ad has high “Back” taps, the agency knows they can increase the “Call to Action” duration to improve direct conversion.
Conversely, an ad with 0 “Back” taps and 90% “Forward” taps is an ad that is being skipped before the message is delivered. This is a “Value Leak.” By monitoring these navigation patterns during a small test run, you can adjust your creative—making text larger, slowing down a video, or moving the link sticker—before scaling the budget. In the world of paid media, “Back” taps are the “Free Education” that tells you exactly how to spend your next $1,000 more effectively.
10. Content Density Strategy
The secret to high “Back” metrics is Intentional Density. This is a design philosophy where you provide more information than can be comfortably consumed in 10 seconds. Think of a “Hidden Object” photo, a “Reading Recommendation” list, or a “Detailed Blueprint” of a house. These formats are “designed to be re-watched.” In 2026, this is a core pillar of the “Value Creator” movement. You are providing so much utility that the user *must* stop and backtrack.
However, you must maintain Visual Balance. If a slide is just a wall of text, the brain skips it. If it is a beautiful photo with one tiny, interesting secret in the corner, the brain engages. Professionals often use “Overlay text” that appears only in the last 2 seconds of a 15-second video. This “Sting” at the end often catches users by surprise, causing them to tap back to read what they missed. This is a tactical application of density that maximizes interaction without hurting the viewer experience.
11. Video Looping & “Back” Stats
Video format significantly alters how “Back” taps are recorded. In 2026, Instagram Story videos can be up to 60 seconds long without being split. When a user taps back on a 60-second video, it returns them to the **Beginning of the Video**, not just 15 seconds back. This is a massive commitment from the viewer. If they are willing to watch a 45-second video again from the start, your engagement score for that session will skyrocket.
To capitalize on this, use Seamless Loops. If your video ends at the exact same frame it began, users may not realize it has ended, and as they realize they missed a detail, they will tap back to see the “Full Loop” again. This “Circular Consumption” is the technical foundation of viral video content. Every “Back” tap on a long video provides the algorithm with a “Long-Duration Retention Signal,” which is the single most powerful factor in Story amplification today.
12. Forensic Engagement Audits
A “Forensic Audit” involves looking at your Story sequence as a Retention Funnel. If Slide 1 has 1,000 views and 5 Back taps, and Slide 5 has 200 views and 100 Back taps, the funnel is clear. Slide 5 is where your “True Fans” are. These are the people who are not just passively swiping, but are deeply invested in the content you’ve provided. This data helps you identify your **”Super Content.”**
Professionals perform these audits every 30 days. They look for the “Back Tap Spike.” Once found, they tag that content type for future Content Repurposing. If people went back to see your “Home Office Setup” 200 times, you should take that Story and turn it into a permanent “Reel” or a “Grid Post.” The Story “Back” taps are the “Market Research” that tells you what your audience will actually care about when it’s moved to the permanent feed. It is a risk-free way to test new ideas before committing to full-scale production.
13. The “Easter Egg” Engagement Strategy
One of the most creative ways to use the “Back” metric is the Easter Egg strategy. This involves hiding a small, secret piece of information in one of your Story slides—perhaps a “Flash Sale” code hidden in a background sticker, or a tiny “Thank You” message to a specific fan. When users realize there’s a secret, they will tap back and scan the image like a scavenger hunt. In 2026, this gamification of Stories is a massive trend for cult-following accounts.
By telling your audience “There’s a secret hidden in the next 3 slides,” you are essentially telling them to “Prepare to tap back.” This pre-loads the intention to interact. These purposeful interactions create a “Heatmap” of activity on your account that the algorithm finds irresistible. It turns your Story into a **Mini-Game**, which has significantly higher retention rates than traditional “Talking Head” videos. It is the ultimate evolution of the “Engagement Sticker”—the content itself becomes the engagement tool.
14. Device Interaction & Screen Sensitivity
Technical context matters: Modern 2026 smartphones have Edge-to-Edge sensitive displays. This means the “Back” tap area is physically larger than it was on older devices. This has led to a natural increase in “Back” tap data across the platform. When interpreting your metrics, you must account for “Peripheral Noise.” Users holding a large phone with one hand often accidentally trigger a “Back” tap with their thumb. This is why raw numbers should always be compared against your account’s historical average.
If your “Back” taps have doubled overnight without a change in content, check your “Sticker Placement.” If you moved your ‘Question’ box or ‘Link’ sticker too far to the left, users are likely accidentally tapping the “Back” zone while trying to interact with your poll. Professional design standards suggest keeping all interactive elements in the “Center 60%” of the screen. This ensures that every “Back” tap you record is a Measure of Interest, not a measure of poor UX design. Accurate data starts with accurate placement.
15. The Professional Future of Story Data
As we look toward the next decade, the “Back” metric will likely be replaced or supplemented by Eye-Tracking Data (on devices with advanced sensors) or “Micro-Interaction” heatmaps. But until then, the “Back” tap remains the only proxy we have for “Visual Interest Over Time.” In a world where every platform is fighting for “dwell time,” the ability to pull a user backward against the flow of time is a creator’s most powerful psychological leverage.
The professional future belongs to those who view “Back” as a **Metric of Mastery**. It is the data point that separates the “Shouters” (people who post hoping someone listens) from the “Curators” (people who post knowing someone will watch twice). By mastering this single analytic, you ensure that your Stories are not just viewed, but are studied. In the high-fidelity landscape of 2026, being worth a second look is the only way to remain relevant in a sea of fleeting visuals.
Frequently Asked Questions
Final Thoughts: The Power of the Second Look
In the high-speed economy of digital content, we are often told to be fast, brief, and simple. But the “Back” metric teaches us a different lesson: Depth is the ultimate engagement tool. If you can create a Story that makes a user pause and backtrack, you have won the battle for their attention. In 2026, the creators who succeed are not those with the most views, but those with the “stickiest” content. “Back” isn’t just a navigation button; it is a vote of confidence in your narrative.
Treat your Story analytics as a dialogue with your audience. When they tap “Back,” they are telling you what they care about most. Listen to that data. Build more Information Hubs, experiment with density, and never be afraid to make your audience look twice. By mastering the psychology and the data behind the “Back” tap, you ensure your profile remains a front-row destination in a world of fleeting scrolls. Every tap is a signal—make sure yours is telling a story worth repeating.